The low-grade monsoon pattern continues with some evening showers in Tucson possible from activity in Cochise County today and tomorrow: July 28th, 2026

Summary

Areas with remnant circulation and cloud cover from a mesoscale convective complex (MCC) yesterday will not have any convective initiation today. While moisture remains high in southern Arizona, northern Arizona and most of New Mexico have lower dewpoints. The upper-level flow is from the southeast, and temperatures at 500 mb are still too warm for widespread activity.

Today, storms are most likely on the Colorado Plateau and in Cochise County, with some showers potentially reaching eastern Pima County overnight. Tomorrow and into Wednesday, storm activity is expected to be most organized in southeast Arizona, particularly in Santa Cruz and Cochise counties, while other areas remain relatively dry. The region continues to experience a low-grade monsoon pattern, with more storms expected once upper-level winds shift northeasterly later in the week.

Yesterday’s Weather

A Mesoscale Convective Complex (MCC) developed in northwest Mexico near where the shortwave trough at 300mb and the cold air at 500 mb were analyzed yesterday morning. The model forecasts had a tough time with this as the Convective Available Potential Energy (CAPE) was underestimated on the 12Z run.

GOES-19 infrared satellite imagery from July 27th from 11 am to 4 am this morning, College of DuPage.

By the 21Z model run, the higher CAPE values were observed by satellite and made it into the forecast. Note that neither the 12Z Tucson nor Guymas soundings were available, so from Pima County south to Sonora and Sinaloa is a void of upper-air data. The National Weather Service issued a Flash Flood Watch at 8:39 pm Monday night for Santa Cruz and the southern parts of Cochise counties as the MCC moved northwest. Once the MCC moved further into Arizona, it did run into dry air aloft, and rainfall totals were less. 

21Z HRRR-UA WRF radar reflectivity forecast (left) and observed radar reflectivity (right) from the MRMS system, July 27th 2:30 pm to 8:30 am this morning.

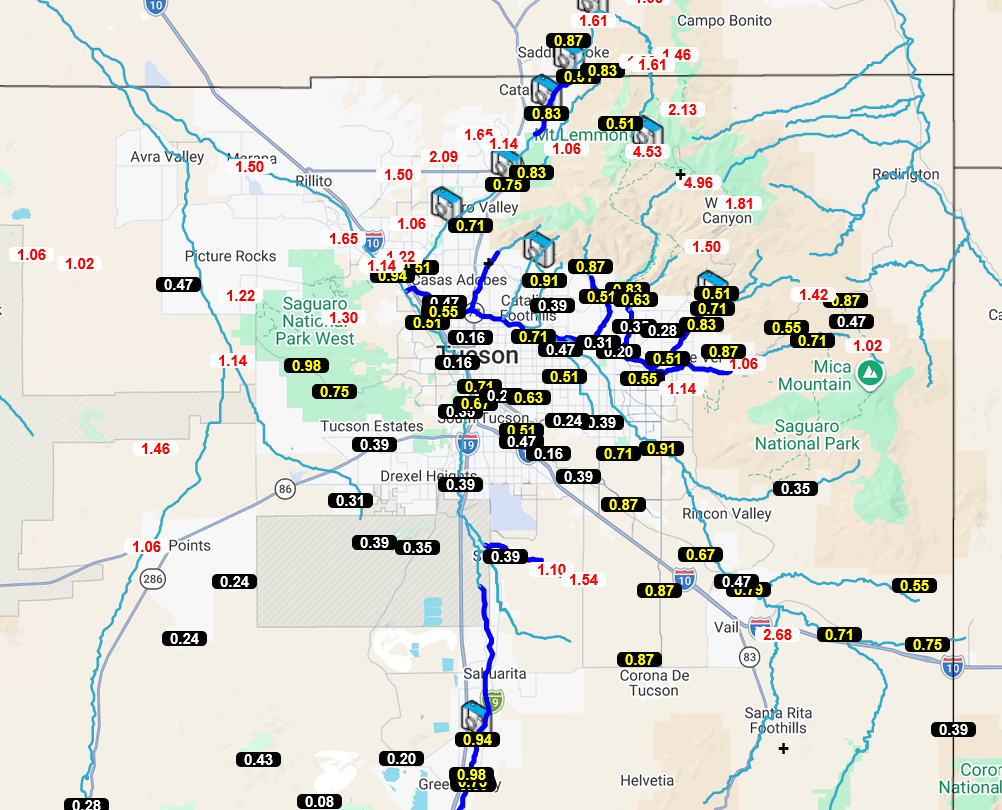
The heaviest rain was observed in Sierra Vista and Nogales, from 1 to 2.5″.

Rainlog.org 24-hour accumulated precipitation gauge observations

Lighter rain fell in Pima County overnight as the remains of the MCC moved northwest. Some valley locations received only trace amounts of rain. 

24-hour precipitation totals from Pima County Regional Flood Control District gauges, Alert Map.

Further north in Maricopa County, the rainfall totals as of 6:30 am are shown below. 

24-hour precipitation totals from Maricopa County Regional Flood Control District gauges, Alert Map.

The HRRR-UA WRF 12Z 24-hour accumulated precipitation forecast (left) and corresponding observed precipitation from MRMS (right) are shown below. The 12Z forecast underestimated the scale and intensity of precipitation from the MCC.

HRRR-UA WRF 12Z 24-hour accumulated precipitation forecast (left) and corresponding observed precipitation from MRMS (right) for July 27th.

The HRRR-UA WRF 21Z accumulated precipitation forecast through to 5 am was much better than the 12Z in Mexico and southern Arizona, but still underestimated precipitation further north in Pinal and Maricopa counties.

HRRR-UA WRF 21Z accumulated precipitation forecast through to 5 am on July 28th.

The visible satellite image combined with lightning data from this morning at 9 am shows the remains of the MCC.

GOES-19 visible satellite imagery overlaid with GLM lightning flashes from July 28th at 9 am, College of DuPage.

Analysis

Surface dewpoint temperatures show moisture remains high in southern Arizona, but dewpoints are below 60°F over northern Arizona and most of New Mexico. 

Surface weather station observations for Arizona and New Mexico at 7:00 am, NWS

The HRRR-UA WRF 12Z initialization (left) and observed (right) sounding for Phoenix at 5 am are probably not much help today, as the balloon was probably launched into the remnants of the MCC this morning. 

HRRR-UA WRF 12Z (left) initialization and observed sounding (right) at Phoenix for 5 am this morning.

At 250mb the monsoon high is in about the same position as yesterday, with two shortwave troughs rotating around the ridge. The one over Arizona this morning is the trough that started the MCS yesterday, with another from El Paso southward into Mexico. 

Similar to yesterday, it’s hard to identify the second trough over El Paso at 500 mb. There is cold air aloft east and south of Yuma, a result of the MCC, and another area of cold air is south of Hermosillo. These are locations cool enough at 500mb to support strong thunderstorms. 

At 700mb, most of the moisture present in Arizona is from the MCC, and no real monsoon flow is established yet. The best location for new thunderstorm development today will be north of the MCC. 

Today

Both the Tucson (below, left) and Flagstaff (below, right) soundings show that there is CAPE available if the convective temperature can be reached. This will be unlikely in Phoenix and Tucson in the wake of the MCC, but around the edge of the remnant MCC, surface heating should be good enough for storms this afternoon and evening. 

HRRR-UA WRF 12Z forecast soundings for Tucson at 4 pm (left) and Flagstaff at 2:30 pm (right).

The 12Z HRRR-UA WRF forecast shows storms in northern Arizona/New Mexico on the Colorado Plateau by 3:30 pm. By 10 pm, storms develop in Cochise County. It’s possible the storms in Cochise County could propagate into eastern Pima County as showers after midnight. 

HRRR-UA WRF 12Z simulated radar reflectivity for today from 1:30 pm to 4 am.

Tomorrow

Tomorrow’s forecast shows isolated mountain storms to the north, but more organized storms in Santa Cruz and Cochise counties. The storms move westward, dissipating as they get into the Tucson area. 

HRRR-UA WRF 12Z simulated radar reflectivity for tomorrow at 5 pm.

Outlook

Similar to Wednesday, the storms form in southeast Arizona and move westward into Tucson before dissipating in central Pima County. Except for southeast Arizona, there are very few storms in the rest of the region.

HRRR-UA WRF 12Z simulated radar reflectivity for Wednesday at 8 pm.

We’re still in a low-grade monsoon pattern until winds aloft shift from the present southeast direction to northeast over the weekend. Then another break for a few days. 

Global Ensemble Forecast System (GEFS) ensemble forecasts of 2-meter temperature (top) and 3-hourly accumulated precipitation (bottom), NCAR.

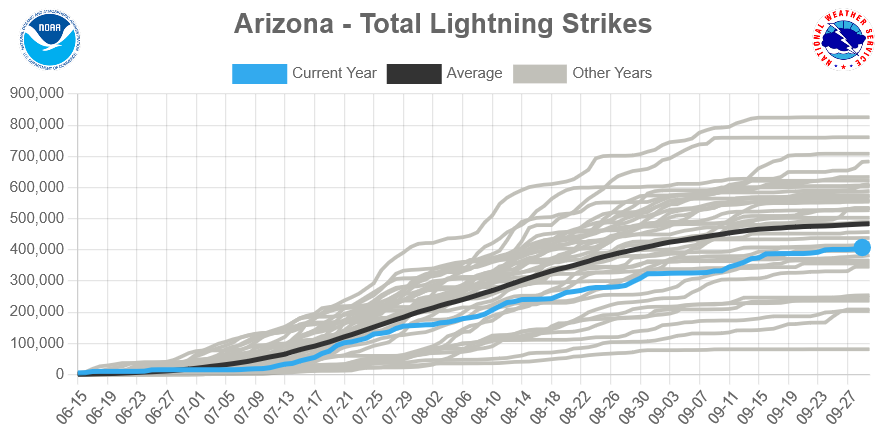
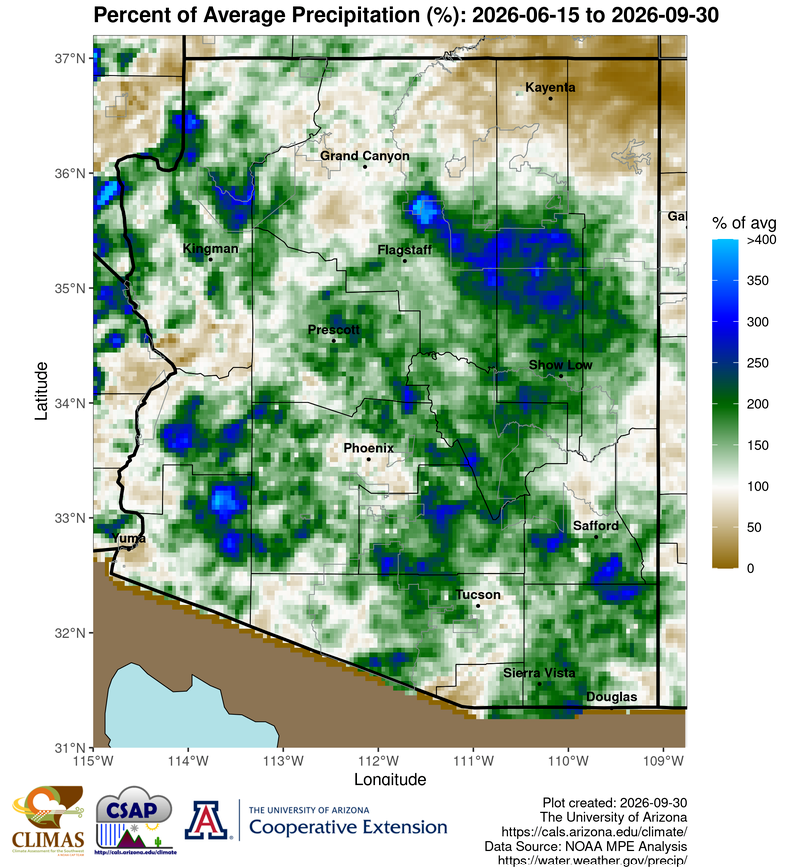
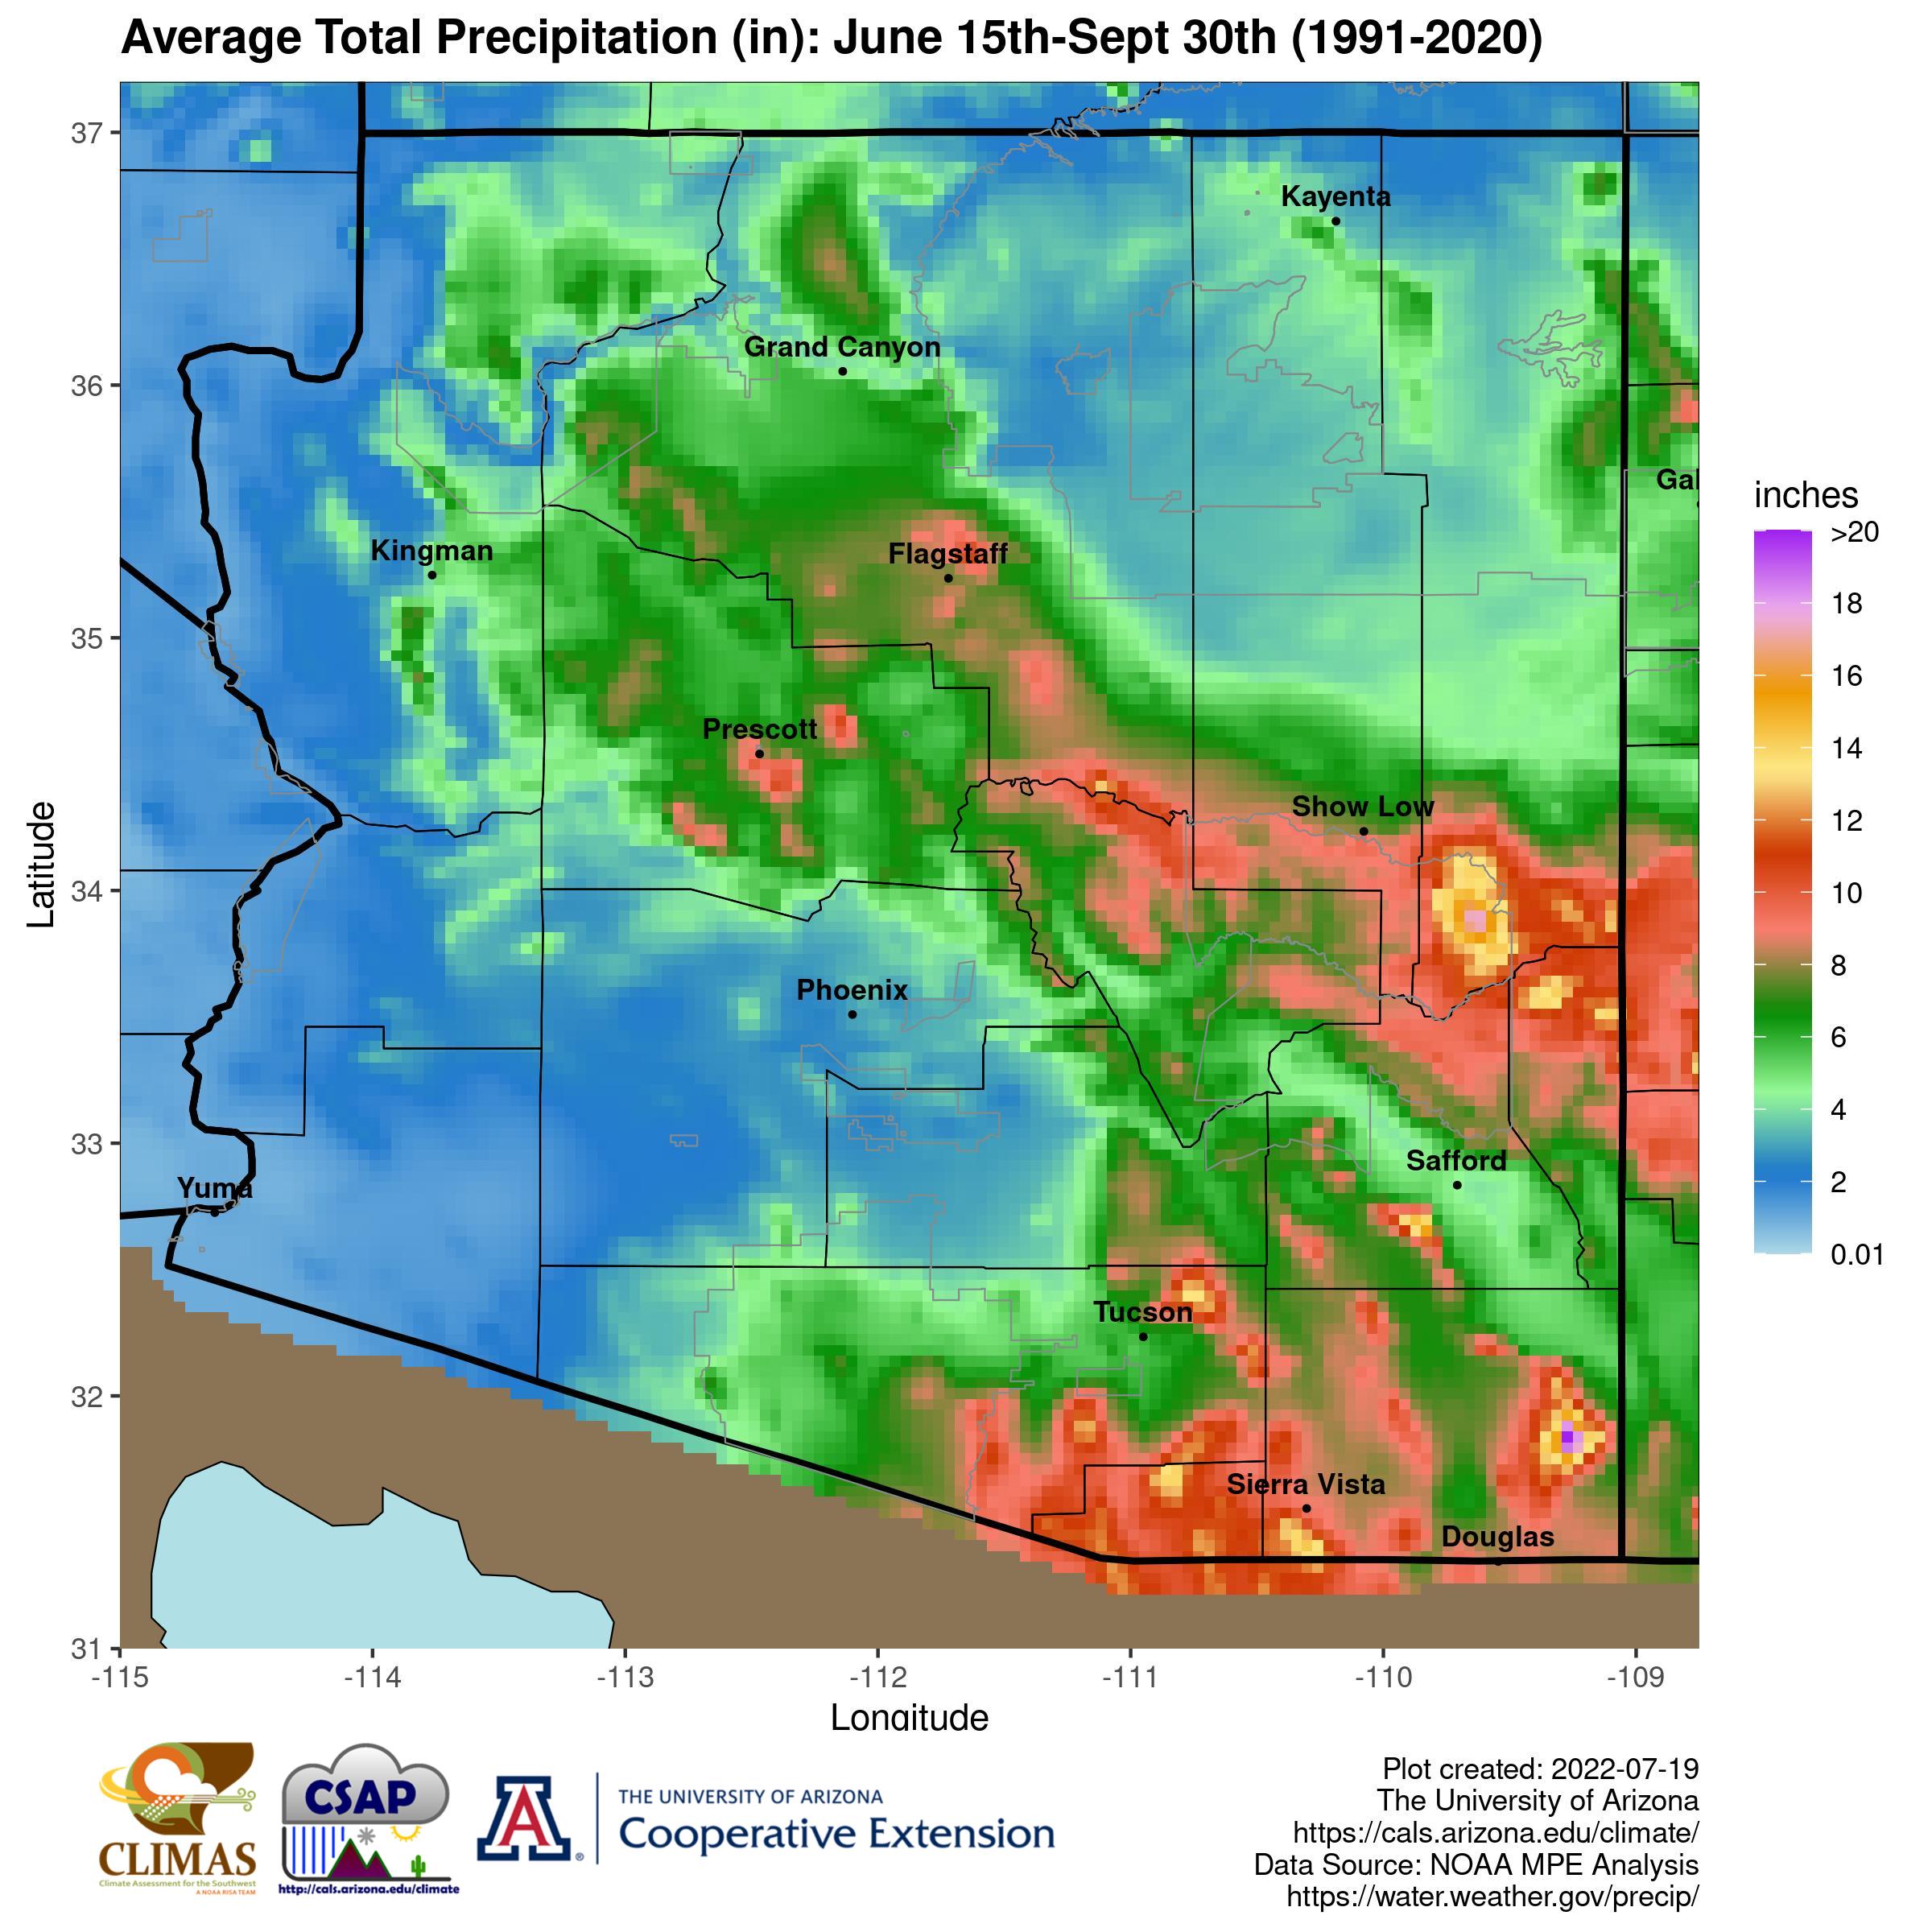
The graphic below is from the Climate Science Applications Program. It shows the percent of average precipitation across the state. This is a tale of two elevations, where areas of higher terrain have enjoyed a good monsoon so far while the valleys are generally below normal. 

Percent of average precipitation; percent of average is calculated by dividing the total accumulated precipitation by the long-term (1991-2020) mean and is an indication of how much totals have deviated from average precipitation for the June 15th to present period. 100% is equal to average for the time period shown on the map.

Discussion written by Pat Holbrook and Patrick Bunn