

Previous two days of weather
The HRRR-UA WRF 12Z forecast from Monday morning (left) versus the observed 48-hour total accumulated precipitation from MRMS (right) shows the forecast captured precipitation coverage well, though totals were lower than predicted. Still, there were some >3.5″ totals recorded in the mountains of eastern Arizona and New Mexico.

The forecast captured the rain bands predicted in the convergence between Hurricane Polo and Odalys outflow and the upper-level low-pressure system, but it overdid cell organization, which may have led to the overestimated total precipitation shown above.
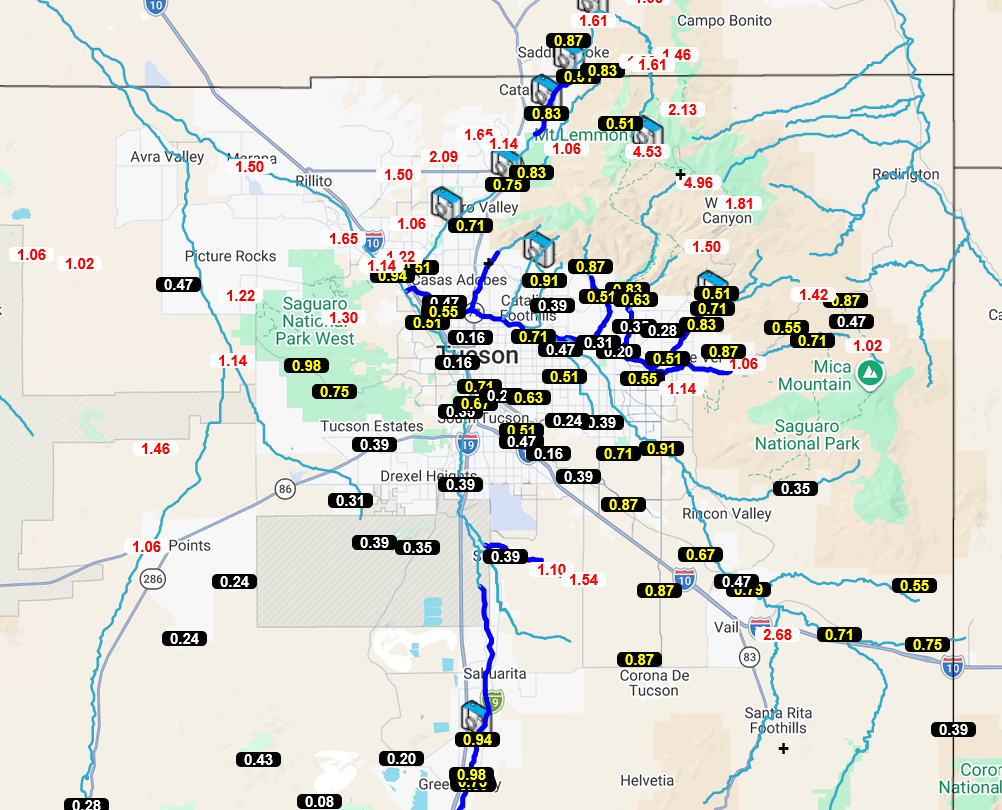
The Pima County Flood Control network shows significant precipitation totals across the region, with greater than 1 inch on surrounding mountains and less than an inch in the Tucson metro area.
Summary
For a visual summary of the 2026 season, the NWS Tucson has some great graphics on their website: https://www.weather.gov/twc/Monsoon
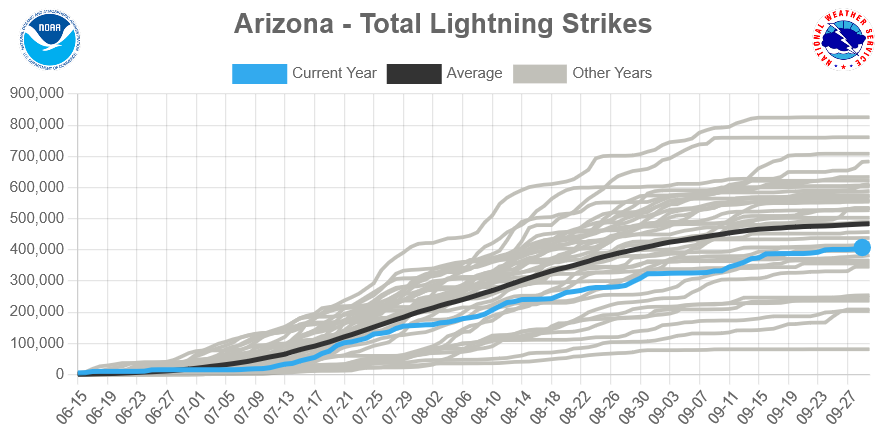
A particularly interesting graphic shows that, while total rainfall amounts were about normal for the various locations they typically report on, the total number of lightning strikes for Arizona was much below normal. This may signal weaker total monsoon activity, since strong updrafts correlate with lightning strikes.
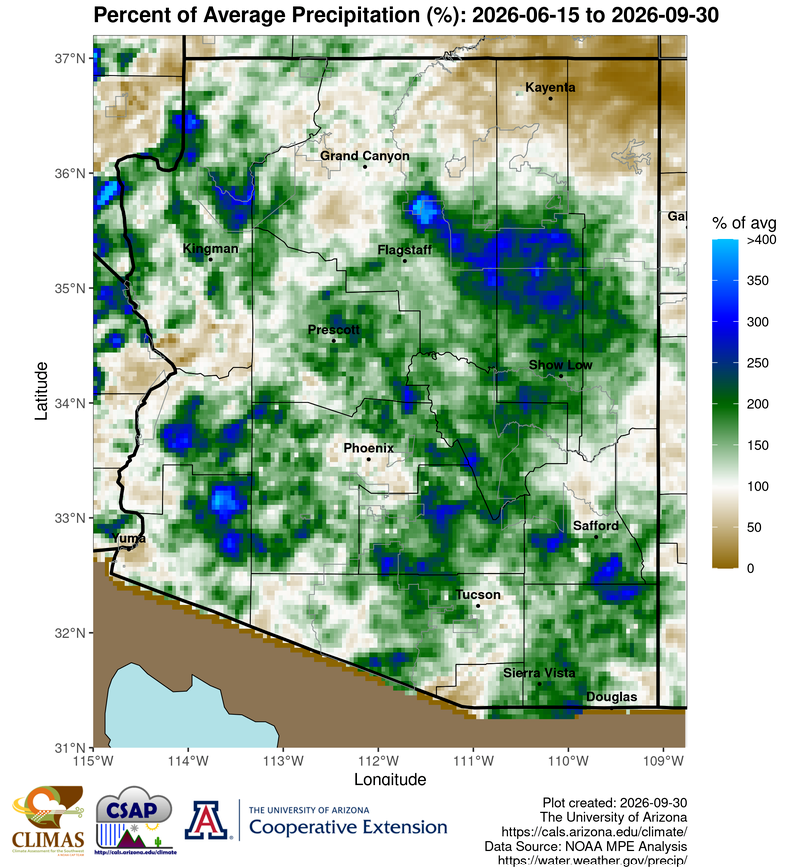
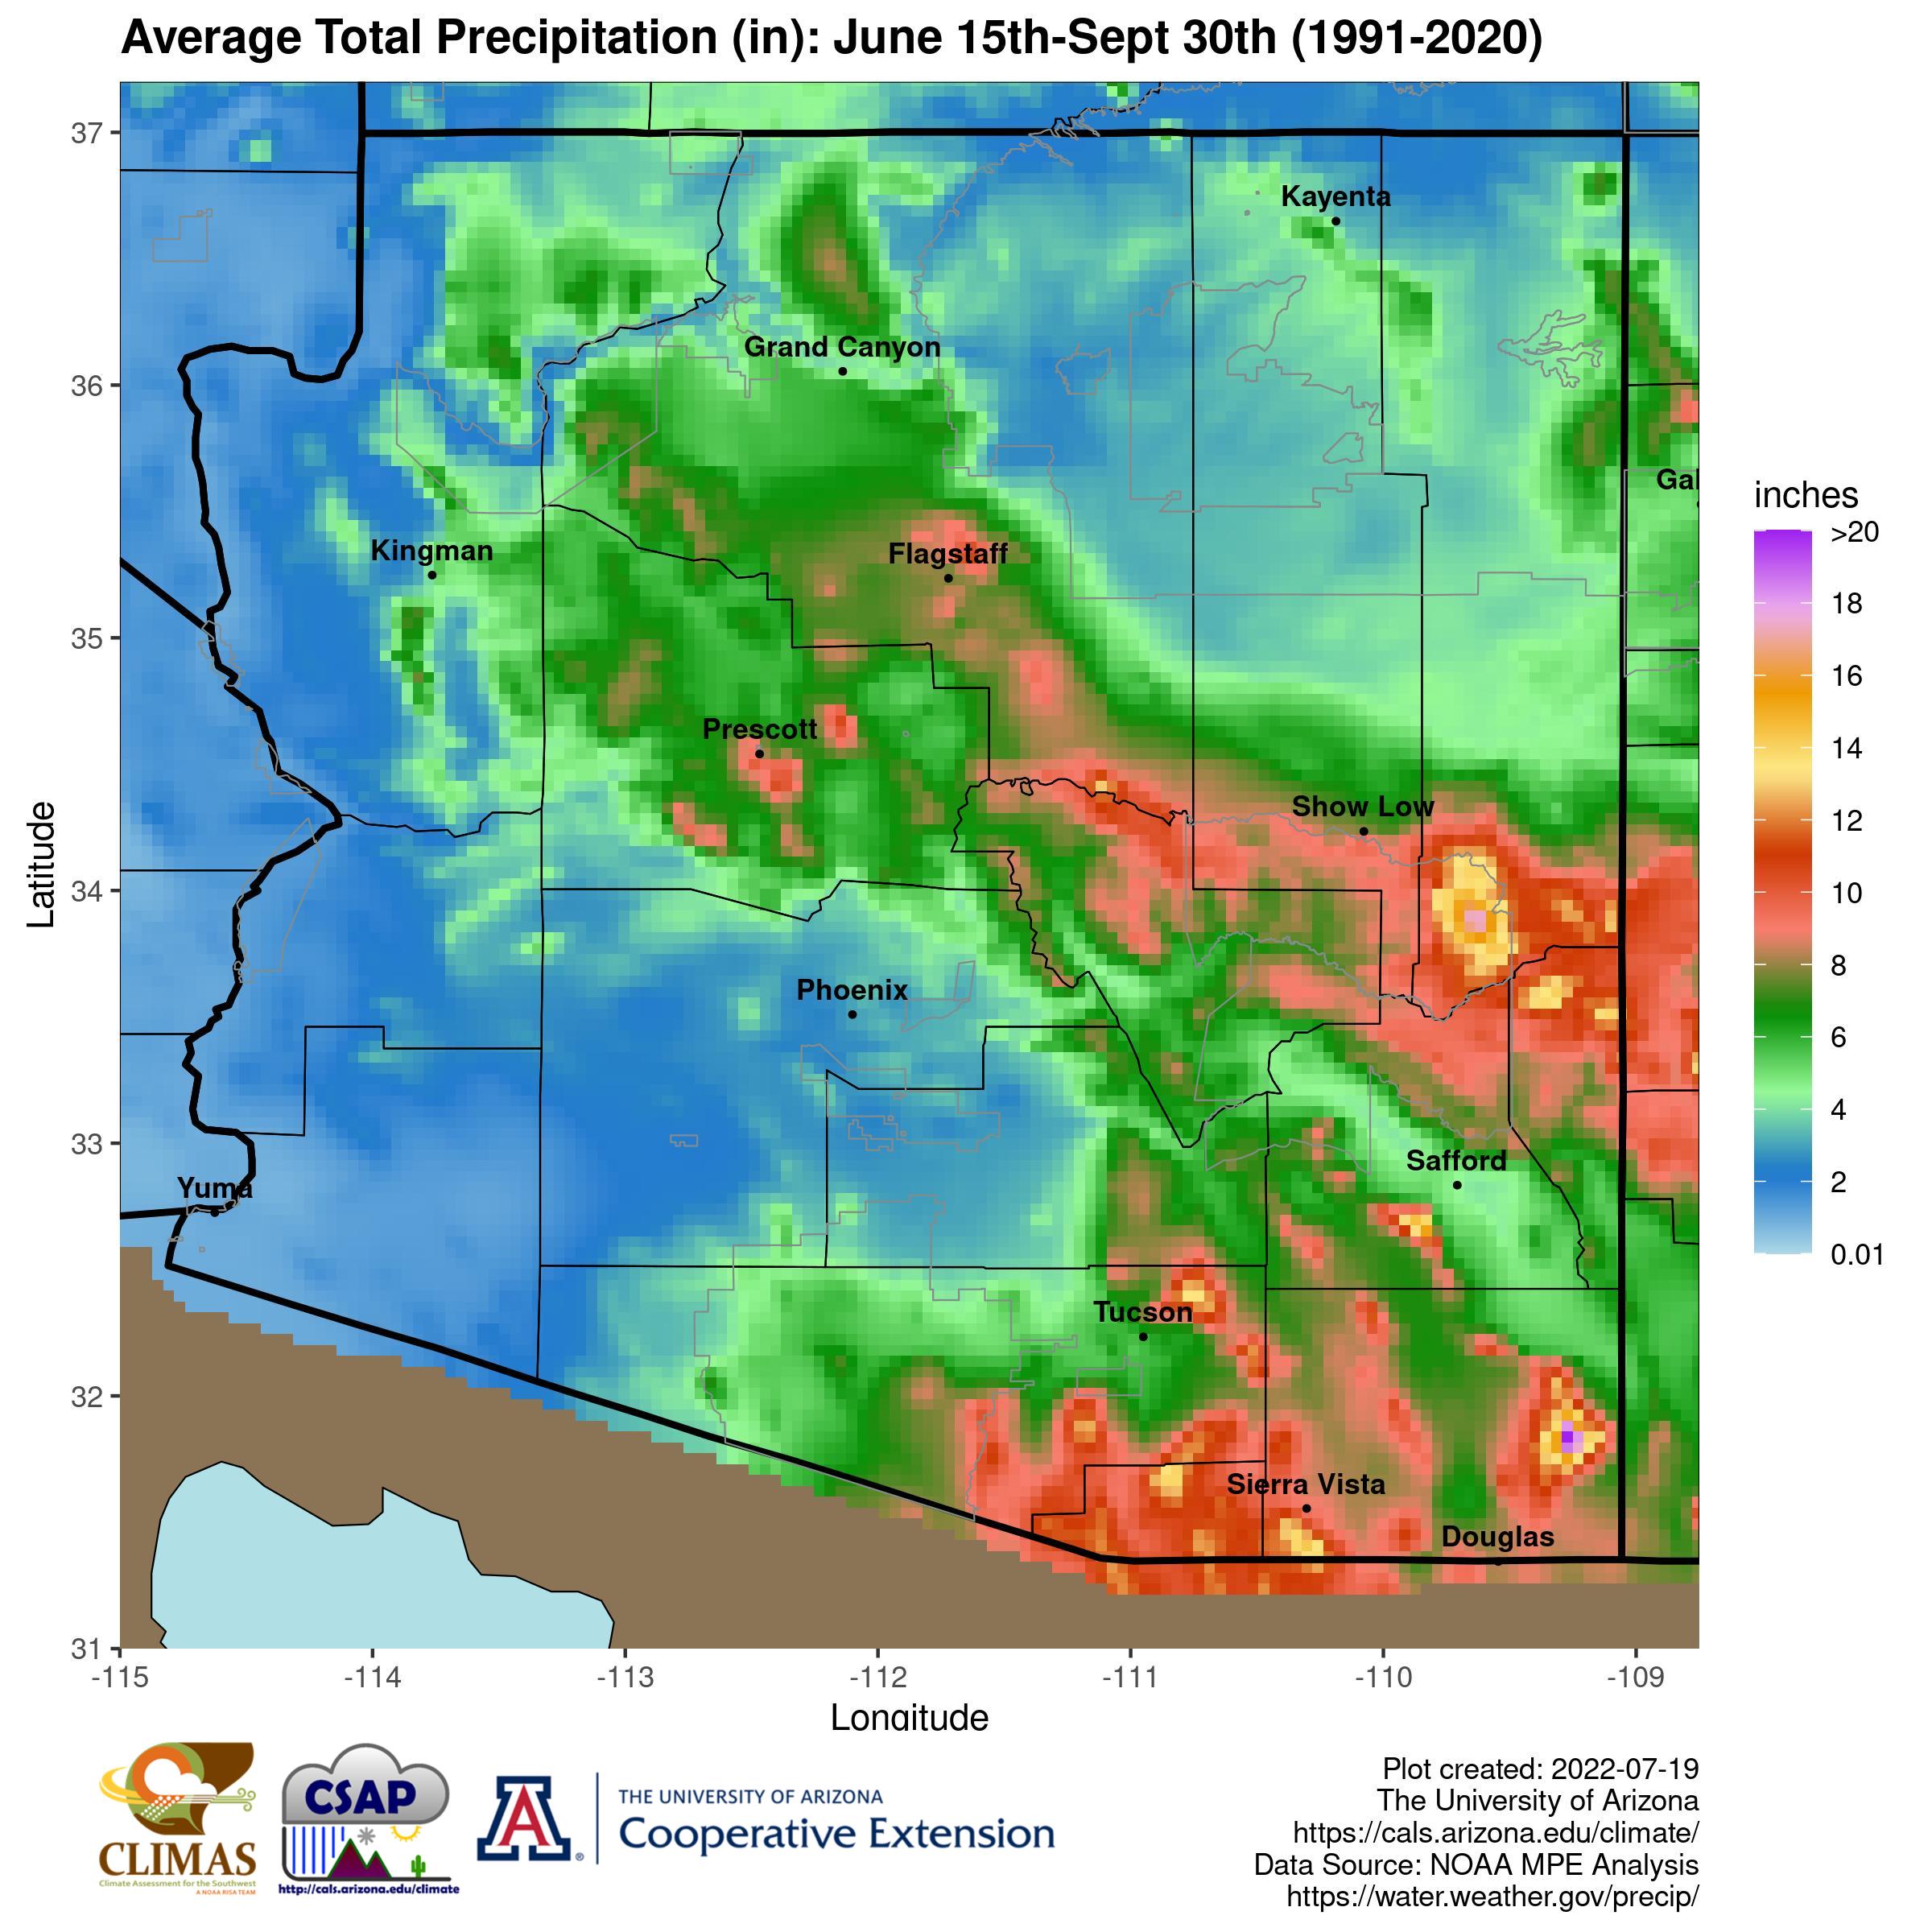
Despite the possibility of reduced updraft intensity over the season, mountainous regions received more than 3 times (blue shading) the 1991-2020 season average, whereas the lower deserts were below average, as shown in the plot below made by Mike Crimmins. A broader subtropical high (monsoon ridge) can weaken steering flow, suggesting a possible seasonal trend in which thunderstorms formed but couldn’t move away from the mountains.
The North American Monsoon season calendar end date is upon us. It’s been an interesting season, and thank you for reading! While our monsoon season discussions are done for another year, the NWS discussions remain a valuable resource to consult for a detailed explanation of the current outlook.
Until next season…