
El Niño-Southern Oscillation
Since the start of the year, we’ve been in the process of shifting from a weak La Niña pattern during last winter to El Niño, as shown below. Specific information on current conditions, outlooks, and history of the El Niño Southern Oscillation can be found at the Climate Prediction Center (CPC) site here.
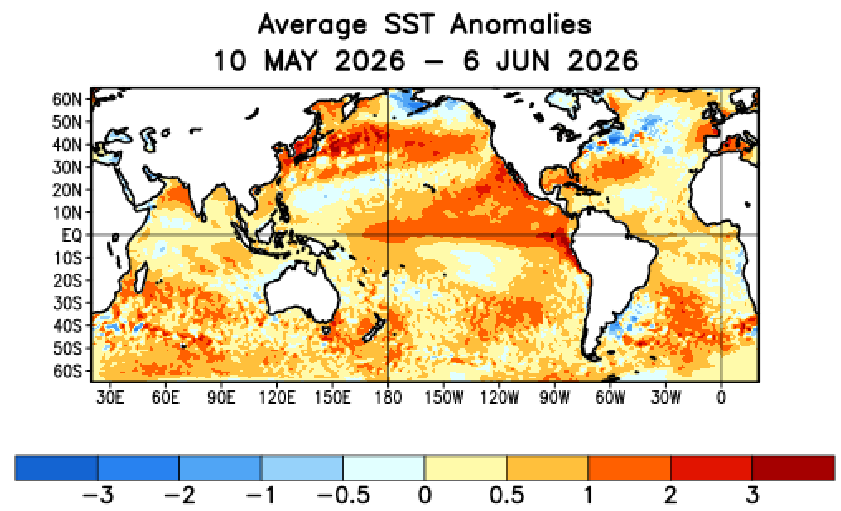
The band of warmer-than-normal water along the equatorial Pacific shows the developing El Niño, where sea surface temperature anomalies (>. 5°C) continue to expand and strengthen. One indicator of ENSO conditions, the Niño 3.4 index (a three-month average of +0.5°C or greater), reached the threshold for March-April-May, signaling the start of El Niño. Since then, the threshold has been surpassed many times on a week-to-week basis.
The Southern Oscillation, the -SO part of ENSO, is the atmospheric circulation pattern established by anomalously warm/cool sea surface temperatures. Warm temperatures tend to change the typically easterly trade winds to westerlies. The wind anomalies at 850mb, though, aren’t strong yet. Though there has been talk of a strong El Niño “Super-El Niño,” that isn’t the current situation yet, even though forecasts are still predicting this El Niño to be a strong one.

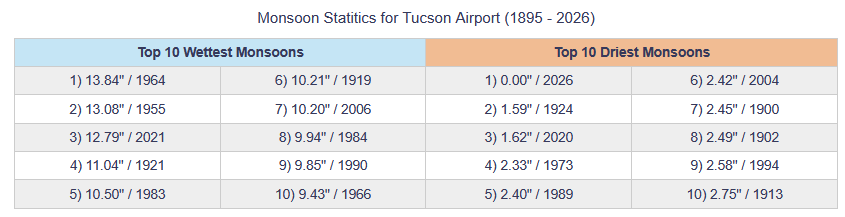
The other question is how El Niño will affect the upcoming monsoon? Research indicates there isn’t a clear relationship between monsoon precipitation and the El Niño Southern Oscillation (ENSO), with positive phase ENSO years allowing for different types of monsoon season (early/late, dry/wet). The table below shows the top 10 wettest and driest monsoon-season precipitation totals at the Tucson Airport; among the wettest monsoons, only 1 or 2 occurred during El Niño.
That said, winter precipitation is strongly influenced by ENSO, with El Niño tending to be wetter and La Niña drier. The CPC forecast of a wetter-than-normal monsoon season may be due to Eastern Pacific hurricane activity; El Niño does have a positive impact on East-Pac hurricane activity.
And, as always, the problem of trying to forecast precipitation amounts for the monsoon is the randomness of thunderstorms! So, are the storms we have seen in the past few days the monsoon? Purists would say no, because the westerlies still dominate the general circulation…but how are we to know if that happened in other years?
Dewpoint temperatures have at times exceeded 54°F, but the daily averages are still likely to remain below this threshold in Tucson.

Past Weather
The water vapor satellite imagery below shows broad subtropical mid-level moisture from the tropics to the Midwest. Earlier in the week in Arizona, surface moisture was low, so not much precipitation reached the ground, with the threat from thunderstorms being lightning, isolated heavy rain, and microbursts.

Sierra Vista had a 59 mph microburst Saturday, and a thunderstorm produced a small fire in the Rincon Mountains at Saguaro National Park East.
The storms on Sunday produced a 74 mph wind gust at Fort Bliss, Texas. Winds were gusty in Arizona Sunday evening.
Analysis
More moisture is in southern Arizona, with 60°F dewpoint temperatures returning in Pima, Pinal, and Santa Cruz counties. Yesterday, storms that formed entrained dry, low-dewpoint air from the lower deserts, preventing them from moving into the valleys. Outflow boundaries pushed through the valley from the south and mixed up the boundary layer yesterday evening…so that problem does not appear to exist today, with overnight and morning showers in the Tucson valley.

The storm-total precipitation map as of 5 am this morning is shown below. It didn’t rain everywhere, and the heavier precipitation was from training storms through the night. So, some areas received over 2 inches of rain, but the NWS did not issue any flash flood warnings.

This morning’s GOES-19 visible satellite picture (below, right) shows the storms over Arizona. The HRRR-UAWRF 12Z initialization (below, left) has the clouds in the Tucson and Gila Bend area correctly placed, but has some clouds in Phoenix that aren’t in the satellite imagery.

At 250mb, the monsoon ridge is south of the Texas Big Bend. A trough extends from southern Wyoming westward to northern California. Another trough extends from the tropical Pacific northward a few hundred miles west of Los Angeles. Wind speed ranges from 40 knots in Arizona to 80 knots in eastern New Mexico.

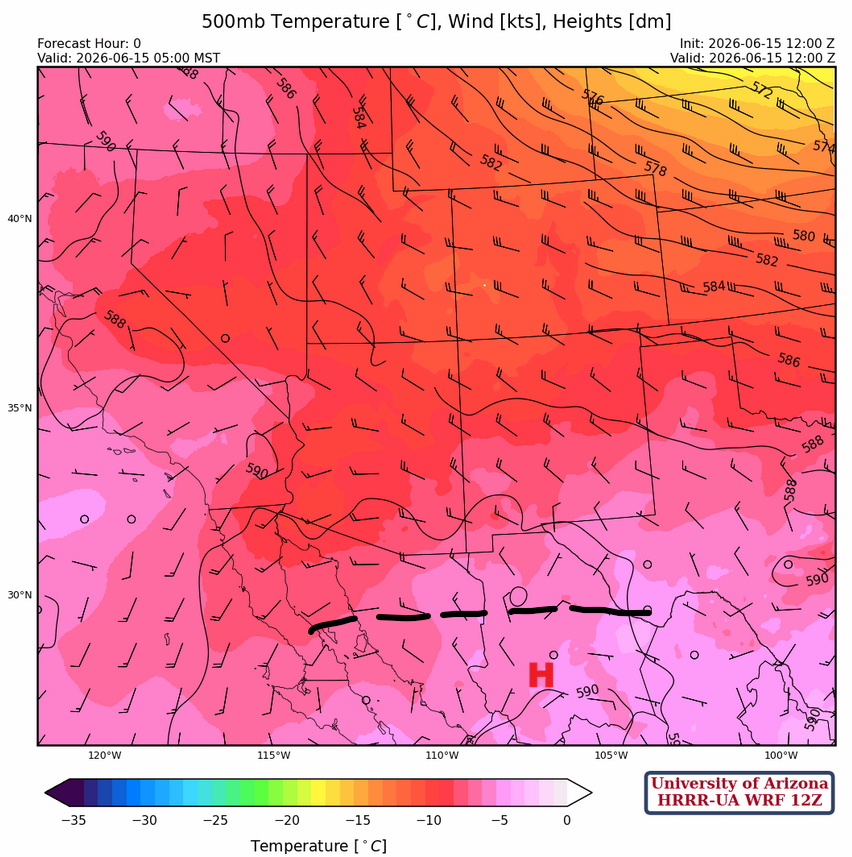
At 500mb, the monsoon ridge is near Hermosillo with a west-to-east axis across Mexico. Most of Arizona has temperatures below –10°C, with westerly winds around 25 knots.
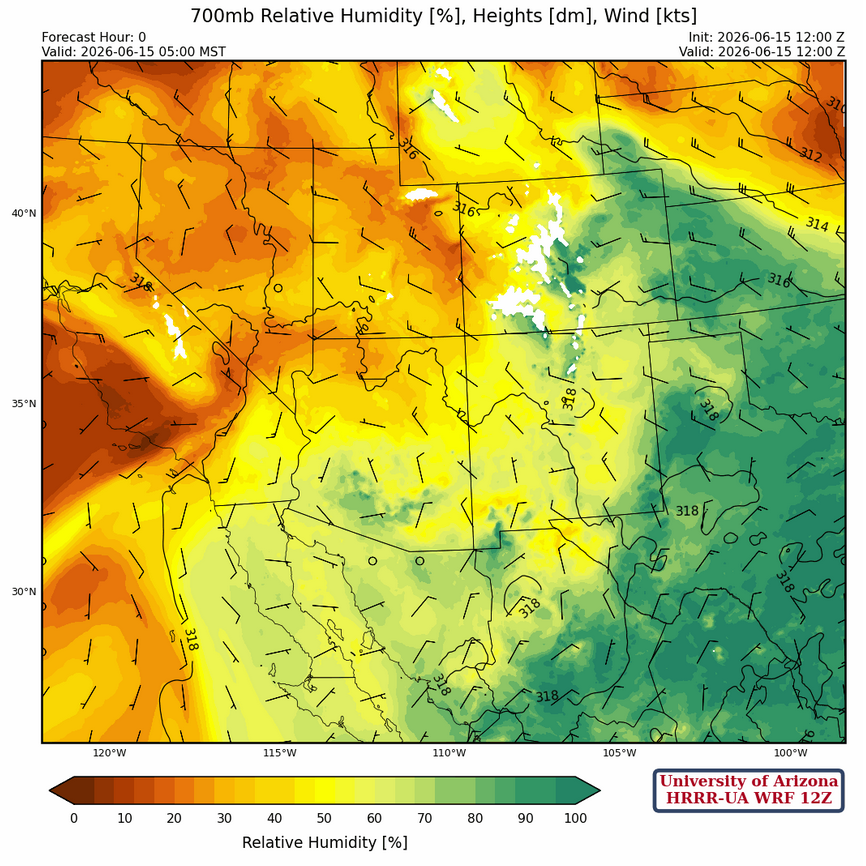
At 700mb, winds are light with the center of the ridge between Tucson and Phoenix.
Currently, there are no weather balloon launches happening in Tucson; it’s a real shame that we don’t have any observations here anymore. They are a critical piece in understanding current conditions, particularly through monsoon season, and enable models and us to make better predictions. Launches have resumed for the monsoon season in Phoenix as of yesterday, likely due to funding provided by SRP; thank you! Below, we compare the forecast initialization to the observed sounding at 5 am this morning. Slightly drier in the observations compared to model initialization today, at the surface and total column precipitable water. Warmer upper levels in the observations eliminate the Convective Available Potential Energy (CAPE) that’s incorrect in the model. Mid-level dry air in the observations matches what we saw in the cloud initialization, where the model has misplaced clouds over Phoenix.

Today
The HRRR-UA WRF 12Z forecast soundings this afternoon for Gila Bend (below left) and Tucson (below right).

There is more Convective Available Potential Energy (CAPE) in Gila Bend than in Tucson, >1500 [J/kg] vs 300 [J/kg], as supported by the radar and precipitation forecasts below, which show the strongest storms west of the storms we have this morning. The morning clouds shown earlier are inhibiting the surface heating needed for thunderstorm development. Outflows could cross onto I-10 between Tucson and Phoenix and I-8, causing blowing dust around 7 pm.
Finally, the total accumulated precipitation is through midnight. Heaviest precipitation is mainly in areas of higher elevation west/southwest of Tucson and Phoenix, and on the Tohono O’odham Nation.

Tomorrow
Fewer storms on Tuesday, with the cells farther south and mainly on the mountains near the International Border.
Outlook
More storms again Wednesday with strong gusty winds and better coverage in Cochise County and western New Mexico. Still, most storms will be near the mountains.

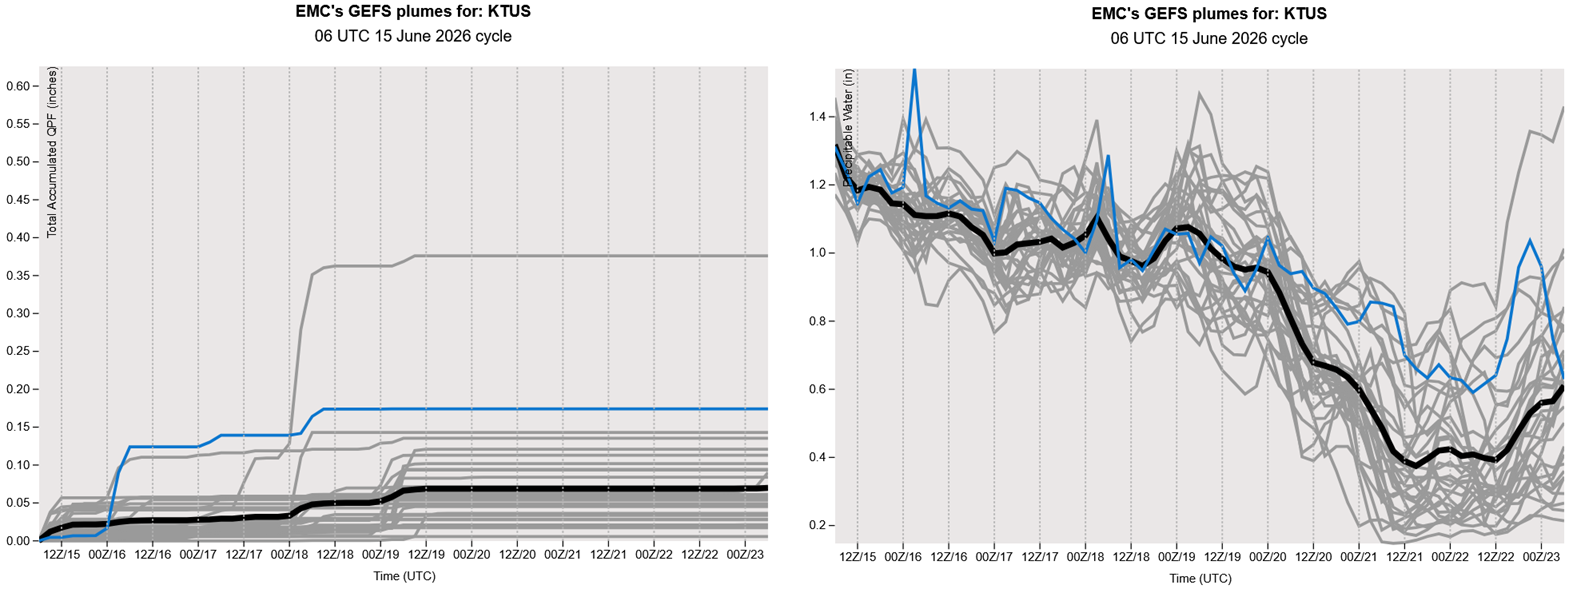
The two plots below show precipitation and precipitable water values for Tucson. Except for the outlier, the precipitable water values drop by next week. Monsoon moisture tends to ebb and flow during the season, and the global model is showing the ebb through the remainder of the week into next.
Discussion written by Pat Holbrook and Patrick Bunn